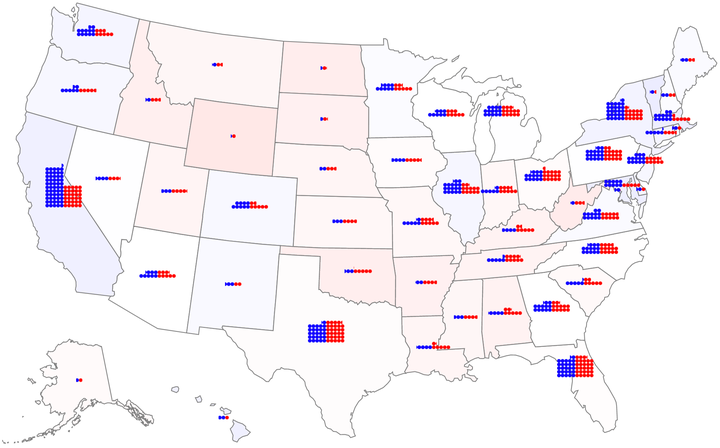
2020 Election Map
Visualizing the popular vote by state for the 2020 US Presidential election.
TLDR: Click here to visit the 2020 map.
Four years ago, I put together a short post about the challenges of mapping election results in US Presedential elections. The core of the issue is the sharp difference between population density and land area. Maps tend to focus on land area, while votes are cast by people. Yet votes in the US aren’t entirely disconnected from area due to our country’s state-by-state voting system. The popular vote matters in each state, but the ultimate winner is decided by votes of official electors put forward by each state to participate in the electoral college. The end result of this system is that winning a state by 5 million votes doesn’t earn a candidate any more than winning by 1 vote. This means that the final election result can distort the perception of popular support for a candidate. I proposed a map design four years ago that tried to communicate a balanced view of both state-by-state and popular vote margins.
This election cycle, I was asked on Twitter to reproduce the map for 2020 results. I crafted the 2016 map by hand, so it wasn’t the simplest task to update it with new data. Therefore, I set out to create a similar map for 2020 that could be reused and updated as the results continue to be certified.
Want to take a look? Click here to check out the latest map!