Alex Rich Discusses Iterative Visualiation Design in New Nightingale Article
The CDC uses visualization to communicate. There’s always room for improvement…

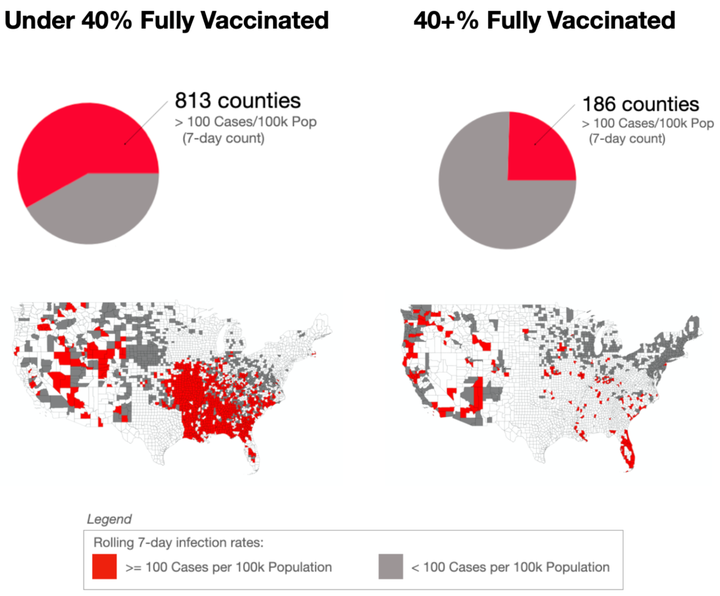
In a new article in Nightingale, the Journal of the Data Visualiztion Society, VACLab teammate and CHIP PhD student Alex Rich describes how visualizaiton design critiques and iterative re-design can lead to better results. To quote the article: “The US Centers for Disease Control and Prevention has had its hands full for the last year and a half. It’s an agency full of talented, dedicated professionals doing their best to protect the country from what we all hope is a once-in-a-lifetime pandemic. That said, there’s always room for improvement and the graphic below is a great example. What follows is an uninvited design critique, but is shared with the best of intentions and full respect for the courage and integrity it took to put the original work out there. My effort to improve on the original is also imperfect, and I hope you’ll share the spots where you think I could do better.”
Read the full article on the Nightingale website.
Reference
Alex Rich. How to Iterate on a CDC Health Advisory Graphic. Nightingale. Journal of the Data Visualization Society (2021).